About
BLOG

Interested in a little light reading?

Our blog is continually updated with helpful educational information, advises, research and insights—all in the name of helping you level-up your color and appearance needs. Grab a drink and enjoy our stories!

Explore Our Stories

"Analyzing the Quality of Baked Products Using Spectrophotometric Color Measurement"

Read More

Explore Our Products

VIEW MORE

"Spectrophotometrically Measuring the Color of Beans Is Instrumental to Quality Assurance"

Read More

"The Future of Water Quality Testing: Spectrophotometers to Stave Off Disaster"

Read More

"Why a Large Surface Area Measurement Matters in Spectrophotometric Analysis of Food"

Read More

"Color Scores: Ensuring Your Tomatoes Make the Grade"

Read More

"Spectrophotometers for Monitoring Shelf Life of Hamburger Meat Improves Marketability"

Read More

"Using the Gardner Scale to Enhance Quality and Create Color Consistency in Edible Oils"

Read More

Analyzing the Quality of Baked Products Using Spectrophotometric Color Measurement

Posted on Feb 16, 2024 by HunterLab

Analyzing the quality of baked products via spectrophotometric color measurement is essential to ensuring consumer satisfaction. Image Source: Pexels user pixabay.com

One of the best parts of my morning is walking into my local bakery and smelling the aroma of the freshly baked breads, cakes, and cookies, all right out of the oven and ready to entice the day’s customers. When buying bagged or boxed baked goods at the grocery store, however, there are no scent cues to guide my purchasing decisions. Instead, I must rely solely on sight to assess whether or not a product looks tasty.

Luckily, the color of baked foods can tell you a lot, giving you vital clues about potential flavor and even texture based on hue alone. Chances are you’ll pass over the cookies that just a bit too darkened, but you’ll reach for ones with just the right amount of browning, believing they’ll taste just right. Food manufacturers know this and are deeply aware of the impact the look of their products has on consumer choice. Thus, instrumental color measurement is an essential part of analyzing the quality of baked products for food manufacturers around the world.

The color of baked goods is the product of Maillard reactions, a complex series of chemical reactions that give cookies, breads, and cakes their distinctive color, smell, and taste. Image Source: Pexels user Padurariu Alexandru

Posted in Color In Food Industry

Spectrophotometrically Measuring the Color of Beans Is Instrumental to Quality Assurance

Posted on Feb 16, 2024 by HunterLab

The color of beans is an important indicator of quality, as out of spec color may indicate a substandard product Image Source: Flickr user missuscallaway

Beans are one of the oldest cultivated plants in the world and have served as a vital source of dietary protein for thousands of years. Today, there are over 40,000 bean varieties in existence, with dozens being commercially mass-produced for the consumer market in countries around the world. Although beans share a similar general appearance, different types vary greatly in flavor and aroma profile, giving each one a unique place within the culinary spectrum.1 For bean producers and commercial food companies that buy beans, establishing quality control parameters for each bean variety is essential to ensuring that bean lots consistently meets expectations.

Because the color of beans  acts as a primary quality indicator, spectrophotometric color measurement is considered a critical part of quality assurance protocols and may be applied to any bean variety.2 Not only is spectrophotometric color measurement a valuable part of your internal quality assessment processes, it is also vital to ensuring that both raw and processed beans meet federal regulations for color quality and consistency.3 As Rachael Stothard writes:

Being a natural food stuff, there is bound to be disparity from bean to bean. All types of bean, regardless of the requirement and the reason for processing the bean, can be analyzed the same way; through reflected color measurements; all that is needed is the correct spectrophotometer.4

The nature of beans, however, presents special challenges to spectrophotometric color analysis. By understanding these challenges and the technologies available for overcoming them, you can choose a spectrophotometer with the features necessary to create accurate, reliable, and repeatable measurements.

Posted in Color In Food Industry

The Future of Water Quality Testing: Spectrophotometers to Stave Off Disaster

Posted on Feb 09, 2024 by HunterLab

Water use is ubiquitous throughout the agricultural processes that give rise to most of the foods we eat. Fifty years ago, people assumed this resource was infinite given that they consumed less food than we do today and thus required only one-third of our current water volume use. Now, the competition for water has intensified as the task of feeding seven billion people competes with industrial uses of water for biofuel production, for example, as well as to support urbanization. In this milieu, the reuse of agricultural wastewater that either flows off farm fields (also known as irrigation tailwater) or is effluent from the processing of crops and processed food is increasingly common.

Every part of agricultural production uses water, from growing and washing produce to feeding animals. As the demand for vegetables, fruits and meat has grown, so too has competition over water.
Image Source: Flickr user Darren Flinders

But the details of this solution to water scarcity should not be trivialized. Agricultural wastewater often scores high in organic matter as well as salts, nutrients, pesticides and other chemicals used for the protection of crops and the increase of crop yields. Given the concentrations of these other materials, agricultural wastewater is often blended with lower-salinity source water or even desalinized in order to address the issue of its high salt content. Still, the reuse of contaminated water is an ever-present concern, which can significantly compromise human health by exposing individuals to produce polluted by pathogens or man-made chemicals.

Posted in Color In Food Industry

Why a Large Surface Area Measurement Matters in Spectrophotometric Analysis of Food

Posted on Feb 09, 2024 by HunterLab

Textured and non-uniform food products have always created challenges in color measurement. Sample preparation and size often create limitations on production and quality control when working with multiple samples or larger food products. Traditional color spectrophotometers only allow for one sample reading at a time, which can be both labor and time-consuming. However, SMART technology provides a solution to areas where traditional spectrophotometers have fallen short. These new innovations are specifically tailored to meet the growing demands of the food industry.

Bigger is Better

With food measurement, size really does matter. A typical color spectrophotometer uses only a single 1” diameter per reading, limiting sample size and surface area. Many foods, such as cookies and snack bars, do not fit the typical sample size parameters of traditional instrumentation, therefore requiring multiple readings or sample decomposition to obtain accurate results.

Portable spectrophotometers only allow for one measurement at a time and require multiple readings to determine product consistency from batch to batch. With a high demand for product yield, manufacturers must perform hundreds of individual sample readings each day, equating to hours of added production time and the increased possibility of human error. Standard benchtop models are also limited by sample surface size, decreasing their efficiency and accuracy. With standard benchtop spectrophotometers, many product samples must either be compromised to fit the average sample cell holder or be crushed or ground into a powder to create a more uniform appearance. Not only does this method waste viable product, it does not provide accurate visual data in a way that it is seen by the consumer. With limited sample surface area, often only a small portion of the product is measured at a time, therefore not giving an accurate representation of batch-to-batch color quality and consistency. However, new technologies are providing solutions to these challenges by expanding sample area size.

The Aeros spectrophotometer offers the largest sample area measurement on the market today. With a non-contact, rotating platform and SMART technology, this instrumentation is in a league of its own. In comparison to the single 1” diameter standard color spectrophotometer sample area, the Aeros boasts a huge 7” rotating sample holder, which provides multiple one-inch sample reading every second. A complete rotation only takes 5 seconds, equating to 35 measurements and a total of 27.50 square inches of sample surface. These measurements are then averaged to provide a comprehensive evaluation of the sample as a whole. This unique advantage can provide a full surface reading for larger samples or allow for multiple samples to be measured at one time, ensuring the most accurate and consistent results. Additionally, the larger sample area holder accommodates a variety of containers and sizes for multiple product measurement in one sample collection. It is versatile enough to even measure products in their final packaging state for the most accurate color data in relation to consumer perception.

The Aeros offers the largest sample area measurement in the world, resulting in more accurate results. Image Source: Shutterstock user Elena Veselova


Posted in Color In Food Industry

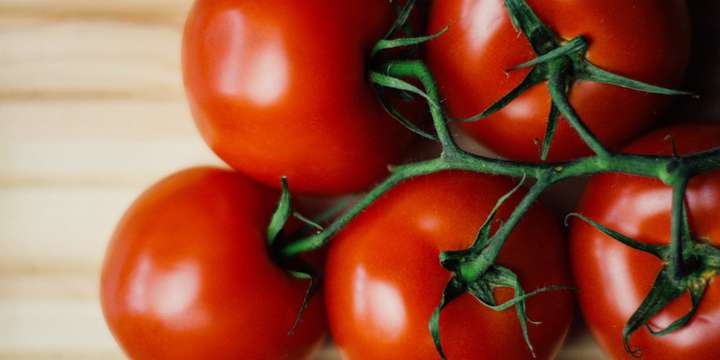
Color Scores: Ensuring Your Tomatoes Make the Grade

Posted on Feb 09, 2024 by HunterLab

Color is an important attribute of tomato quality. It is therefore precisely measured in raw tomatoes and tomato products to ensure consistent quality. 

The colorimetric grading scale and tomato grading standards help producers, tomato processors, and other stakeholders select the right tomatoes. Colorimetric scores quantify color to create the measurements needed to relate product quality to a grading scale. These scores and the grading process have been developed through extensive research and analysis to ensure color consistency and maturity.

Today's technological advancements in colorimetric measurement help offer higher standards for tomatoes and tomato-based products by providing fast and accurate testing of tomato color.

What Is Tomato Grading?

Tomato grading is a process for categorizing tomatoes by specific standards. The sizes and color of tomatoes are two factors considered in the grading process. Tomato grading helps set the price for tomatoes and can influence how they are stored, packaged, marketed, and shipped. 

The U.S. Department of Agriculture (USDA) lists the following tomato grades and standards:

  • U.S. No. 1. These tomatoes must be correctly formed and developed, smooth, clean, and mature. They must have uniform color and not be too soft. U.S. No. 1 tomatoes must also be free from damage, including sunscald, decay, and freezing.
  • U.S. No. 2. These tomatoes must be mature, clean, well developed, and uniform in color. They must not be overripe, but they can be slightly rough in texture. They must not be seriously damaged and must specifically show no signs of decay, sunscald, or freezing damage. 
  • U.S. Combination. These tomatoes consist of at least 60% of U.S. No. 1 tomatoes, with the remainder being U.S. No. 2 tomatoes.
  • U.S. No. 3. These tomatoes need to be clean, mature, and uniform in color. They should be well developed and not overripe, but they may have irregular shapes. They must not show any signs of freezing injury, decay, and serious sunscald damage or any other significant damage.

As part of tomato grading, the USDA considers color classification when evaluating the maturity of and thus grading of red-fleshed tomatoes at different tomato ripening stages. The USDA classifies tomatoes into the following colors:

  • Green. These tomatoes have a fully light green to dark green surface. 
  • Breakers. On no more than 10% of the surface of these tomatoes, green gives way to other colors, such as yellow, red, or pink.
  • Turning. On 10%-30% of the surface of these tomatoes, green gives way to red, pink, red, or a combination of these colors. 
  • Pink. On these tomatoes, 30%-60% of the surface is pink or red.
  • Light red. On these tomatoes, at least 60% of the surface is red or pink-red. No more than 90% of the tomato surface can be red.
  • Red. These tomatoes have red on more than 90% of their surface.

There is an objective colorimetric standard scoring system to determine product maturity and quality.

Colorimetric measurement and spectrophotometry are continually developing to meet the standards set forth by the USDA (United States Department of Agriculture). The USDA Processed Products Standards and Quality Certification Program uses a minimum standard grading chart to identify product value based on color measurement and consistencies.

Color is such a strong indicator of product quality that 30 of the 100 points awarded to the product are solely attributed to color alone. However, color measurement does present its challenges and can vary throughout the different stages of development and ripening process.

Posted in Color In Food Industry

Spectrophotometers for Monitoring Shelf Life of Hamburger Meat Improves Marketability

Posted on Feb 09, 2024 by HunterLab

Quality hamburgers start with fresh ground beef, which many consumers measure by the color quality of the raw meat. Image Source: Flickr’ user bour3

Hamburgers are the All-American food and nothing screams summer like the smell of sizzling ground beef on a backyard grill. This summertime tradition has been around for ages and hamburger was once the staple food in the American household. I remember when I was growing up, my mom put hamburger in everything — from the ever-popular varieties of family casseroles to the excitement of the huge metal mixing bowl filled to the brim with ground beef, just waiting for the influx of guests to arrive. Old friends of mine still refer to my mom’s “famous hamburgers” that she would meticulously mix by hand and form into the perfect patty.

While my mom adored her ground beef, she was also quite picky about the quality of meat she chose. We always bought our hamburger meat fresh from the butcher and my mom would carefully inspect the color before purchasing. "Always choose the freshest meat for the best burgers," she would say, as the butcher would hold up a bright pink handful in his gloved hands. As an adult, I now consider myself somewhat of a connoisseur of quality hamburgers and have developed some new favorite recipes that challenge even the best burger joints in town.

Myoglobin is the protein found in ground beef that gives it its red coloring and is recognized as a sign of meat quality and freshness. Image Source: Flickr’ user Artizone

Posted in Color In Food Industry

Using the Gardner Scale to Enhance Quality and Create Color Consistency in Edible Oils

Posted on Feb 09, 2024 by HunterLab

In edible oil production, the color of the product says a lot about its processing, storage, and overall quality. Olive oil is a prime example. Some olive oils are deep gold while others are pale yellow or dark brown. These colors vary widely based on the type of olive that manufacturers use as well as how the product is handled and stored before it's added to the shelves.

Edible oil manufacturers can apply the Gardner scale to create the color consistency they need in their products.

The Gardner scale can be used to give you greater insight into your edible oil products. Image Source: Pexels user Pixabay

Posted in Color In Food Industry
Prev
5
6
7
8
9
…
Next

Most Related Posts

  • Reducing Process Variation of Cocoa Powder With Color Spectrophotometers
  • How Color Measurement via Spectrophotometers Is Bringing Milk Powder Production to New Heights
  • Top 5 Things to Know About Measuring the Color of Spices
  • Dairy Industry Color Standards
  • Measuring the Color of Protein Powder Using Spectrophotometry Enhances Appeal
  • How to Measure the Quality of Spices: Maintaining Color Control with Spectrophotometers
  • Using Coffee Color Analysis to Accurately Measure Light Roasts
More

Follow us on social

  • LinkedIn
  • YouTube
  • facebook
  • X
  • instagram