
The human eye can perceive millions of colors, but it does not always distinguish them accurately. Two slightly different colors may appear the same, or identical colors may look different depending on viewing angle and lighting. This creates challenges when communicating about color. For designers and manufacturers, the inability to precisely identify and communicate color complicates efforts to replicate standards and detect discrepancies.
To reproduce an exact color consistently, manufacturers and designers rely on ways to quantify a color's properties and calculate the numerical difference between colors. CIELAB, or CIE L*a*b*, is a device-independent, three-dimensional color space that measures and compares all perceptible colors using three values. In this space, numerical differences correspond to the degree of change humans can perceive.
CIELAB is based on opponent color theory showing that the brain interprets retinal inputs as differences between light and dark (lightness) and between opposing pairs of colors: red/green and blue/yellow. This is known as the principle of color opposition correlation, as a color cannot be both red and green, or yellow and blue, simultaneously. For example, you will never see a "greenish red.
What Is the CIELAB Color Model?
The L, a, b color space was first defined in 1942 by Richard S. Hunter, founder of HunterLab. Hunter’s system used coordinates labeled L, a, and b, calculated from the CIE 1931 XYZ color space, and was intended to be more perceptually uniform. In 1976, the International Commission on Illumination (CIE) created the CIELAB model as a refinement of Hunter’s work. To distinguish between the two systems, CIELAB uses L*, a*, b* notation. The “CIE” refers to the French name of the organization: Commission Internationale de l'Éclairage.
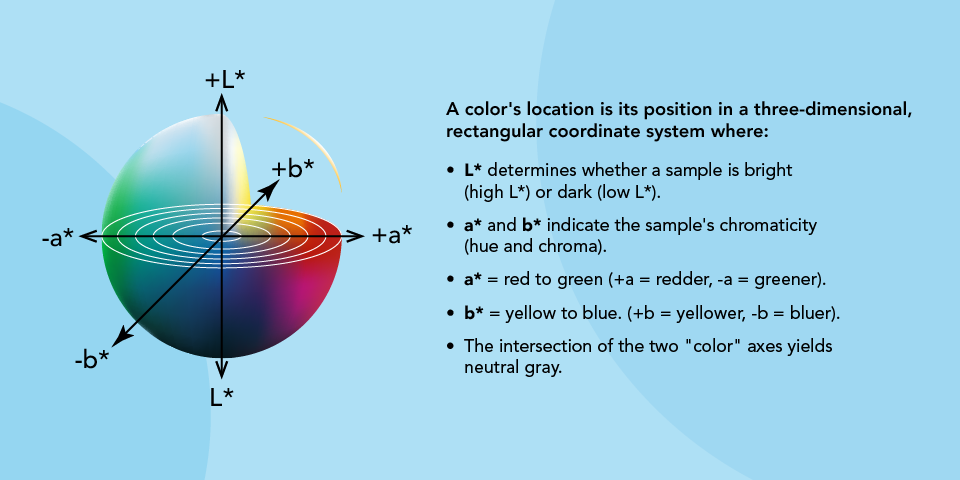
Both Hunter L, a, b and CIELAB (L*, a*, b*) are grounded in Opponent-Color Theory, which assumes that the human eye perceives colors in opposing pairs:
- L scale: Light vs. dark, with low numbers (0–50) indicating dark and high numbers (51–100) indicating light.
- a scale: Red vs. green, with positive values indicating red and negative values indicating green.
- b scale: Yellow vs. blue, with positive values indicating yellow and negative values indicating blue.
An ideal color scale would be uniform, meaning that a one-unit difference would appear visually equal regardless of hue. In practice, neither Hunter L, a, b nor CIELAB is perfectly uniform. Hunter’s scale applies a square root function to Y/Yn for calculating lightness (L), which tends to compress values in the yellow region and expand them in the blue region. CIELAB, by contrast, applies a cube root function to X/Xn, Y/Yn, and Z/Zn, with a linear extension near black. While this improves uniformity overall, CIELAB tends to over-expand the yellow region of color space. Both scales are effective for measurement and for setting tolerance standards. However, CIELAB generally provides a closer match to visual perception. With practice, either system supports intuitive understanding and communication of color values.