A leading global technology manufacturer needed to characterize and control the optical performance of small, multi-layer display components used in smartphones, tablets, automotive dashboards, and AR/VR headsets.
These components often contain embedded sensors and functional coatings—including Face ID modules, anti-reflective layers, diffusers, cover glass, and specialty optical films—that must deliver consistent color, clarity, brightness, and contrast across billions of devices.
Even minor variations in material thickness, coating uniformity, or spectral behavior could compromise sensor performance, reduce display readability, and increase production costs. To prevent downstream failures and tighten quality control, the manufacturer needed objective, traceable optical data at the component level—not just on finished displays.
Display Component Characterization: The hidden measurement work behind the screen you touch
Your phone screen looks simple. You tap it, it lights up, and the colors look “right.”
Inside that display stack sits a long chain of films, coatings, and rigid layers. Each layer changes how light passes through the display and how it reflects back to your eye.
Now add two realities that product teams live with every day.
First, the same display must look consistent across factories and suppliers.
Second, the display must still look good in harsh lighting, wide angles, and low power modes.
That is why display component characterization has become a core measurement workflow for consumer electronics. It covers the color and optical behavior of the materials that sit in, above, and around the display. It also covers the under-display parts that support sensing and authentication.
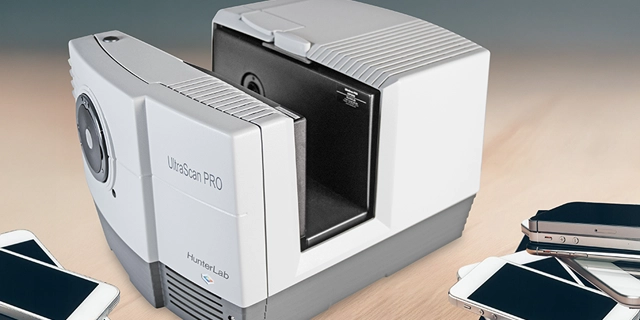
In recent customer conversations, HunterLab connected a pattern that had been hiding in plain sight. Teams that already rely on HunterLab UltraScan Pro for ophthalmic lenses and coated glass use the same approach for small displays. Think smartphones, tablets, laptops, automotive dashboards, and AR or VR wearables.
The workflow travels well because the physics stays the same. Light still transmits, scatters, and reflects through layered materials.
Why "display component characterization" matters
A display is not one part. It is a system of layers.
In LCD and many hybrid stacks, optical films guide and shape the backlight. These films include polarizers and other light-management layers that impact brightness, uniformity, and viewing performance.
In both LCD and OLED stacks, teams also manage cover glass, functional films, and hard coatings. These layers protect the device and shape perceived contrast and color. Even small shifts in transmission or haze can change how text looks on a white background. A minor color shift can make two phones look mismatched on a retail wall.
Automotive displays raise the bar again. Drivers view screens in direct sun, at angles, and through polarized sunglasses. Wearables do the same outdoors, where glare and reflections can drown out dark content.
So teams measure components, not only finished displays. They test diffusers, polarizers, cover glass, optical films, plastics, and specialty layers. They also test coatings designed to manage reflections at specific angles and wavelengths.
The challenges engineers keep running into
1) Color and clarity through multi-layer stacks
When light passes through multiple films, each layer can tint the signal. A small slope change in spectral transmittance can shift whites and skin tones. Layer-to-layer variation can also change clarity, which makes edges look soft. This is not only a “looks” problem. It becomes a yield problem. If the stack drifts, the team tightens tolerances or scraps more material.
2) Anti-reflective behavior across viewing angles
Reflections come from the cover surface and from internal interfaces. Anti-reflective approaches often target specific wavelengths and angles, so teams need spectral data that matches real use cases.
3) Transmission haze that steals sharpness
Haze ties directly to wide-angle scatter. Scatter reduces perceived sharpness and makes blacks look washed out. Many teams track haze and clarity separately because they describe different scattering angles and visual effects. ASTM D1003 is one common reference point for haze and luminous transmittance, and it even includes a spectrophotometer-based procedure.
4) Contrast-related metrics that depend on materials
Contrast ratio is the luminance ratio between the brightest white and darkest black a system can produce. It is also one of the first specs people quote when they compare displays. Component choices influence contrast, in indirect ways. Internal reflections, scatter, and tint all shift perceived black level and white point. That is why teams test the films and coatings upstream.
5) Near-infrared behavior for sensing and authentication
Modern devices also “see” in near-infrared. Apple describes Face ID as projecting thousands of invisible dots to build a depth map, along with capturing an infrared image. Across the industry, many 3D sensing and facial recognition systems use 850 nm or 940 nm class illumination. In customer discussions tied to display stacks, near-infrared reflectance around the mid-900 nm range can matter because sensing components sit beneath display materials. That pushes teams to measure not only visible color, but near-infrared behavior too.
How teams are using color spectrophotometer in practice
In a recent set of customer conversations, a display materials expert described how teams use this kind of instrument for display component characterization. The scope sounded familiar at first. It matched classic UltraScan PRO use in coated glass and ophthalmic materials.
Then the conversation moved to products people carry and drive with:
- Smartphone and tablet displays
- Laptop LCD screens
- Automotive dashboard displays
- AR and VR glasses and headsets
- Other emerging display formats
The same core measurements showed up again and again:
- Color and clarity of multilayer films and coatings
- Anti-reflective coating behavior
- Light transmission, absorbance, and reflectance, with extra focus on diffusing layers
- Transmission haze for sharpness and readability
- Contrast-related metrics that track display performance
- Near-infrared reflectance behavior around the mid-900 nm range for under-display sensing workflows
Two details stood out. One, the customer used the word “rigid materials” for key optical layers—diffusers, polarizers, cover glass, optical films, plastics, and specialty coatings. Those are not “nice to have” layers. They are the stack. Two, everyday authentication technologies continue to drive near-infrared measurement needs, reinforcing the role of projected dots and infrared imaging in modern sensing workflows.
This is where characterization stops being academic. It becomes the bridge between what R&D designs and what manufacturing can hold.