About
BLOG

Interested in a little light reading?

Our blog is continually updated with helpful educational information, advises, research and insights—all in the name of helping you level-up your color and appearance needs. Grab a drink and enjoy our stories!

Explore Our Stories

"Sources for BRDF and BSDF Equipment and Testing Services"

Read More

Explore Our Products

VIEW MORE

"What is the correct light level in lux for a light booth?"

Read More

"Instrument Geometry – Directional 45°/0° or Diffuse d/8° Sphere?"

Read More

"Metamerism Index"

Read More

"Measuring Visual Differences with dE CMC"

Read More

"Where to find pre-soiled and stained fabrics for laundry and cleaning testing"

Read More

"Do you have a formula to convert Hunter Lab values to CIE L*a*b*?"

Read More

Sources for BRDF and BSDF Equipment and Testing Services

Posted on Feb 09, 2024 by HunterLab

In industrial colorimetry of QA non-luminous materials, assumptions are made that light reflected from or transmitted through a surface is relatively uniform, with only diffuse and specular components. To promote inter-instrument agreement, the CIE geometries for collecting the reflected or transmitted signal of non-luminous materials are standardized into directional and diffuse sphere types.

Prismatic highway signage materials tend to reflect light more in a retro-reflective direction than in any other. This is the type of material where a BRDF scattering profile would be useful to know in the research stage.

Posted in Color And Appearance Theory

What is the correct light level in lux for a light booth?

Posted on Feb 09, 2024 by HunterLab

Visual Evaluation of Color Samples in a Light Booth

FAQ: “I want to measure the lux level for a light box we are using to evaluate the color of garments. I would like to know, how many light boxes are required for a room. One light box has four D65 tube rods. My question, Is there any standard value of lux which we need to maintain and how do we find out for that lux level? How many light boxes will be enough.”

The standard illumination on the floor of a light booth should be between 810 and 1880 lux as defined in ASTM D1729 Standard Practice for Visual Appraisal of Colors and Color Differences of Diffusely-Illuminated Opaque Material and identified in Section 6.1.2.“6.1.2 Photometric Conditions—For critical evaluation of color differences of materials of medium lightness, the illumination at the center of the viewed area shall be 1080 to 1340 lx (100 to 125 fc). For general evaluation of materials of medium lightness, the illumination shall be between 810 and 1880 lx, (75 and 175 fc). In either case, for viewing very light materials, the illumination may be as low as 540 lx (50 fc), and for viewing very dark materials it may be as high as 2150 lx (200 fc). This higher level of illumination is usually obtained by holding the specimens nearer the source.”

If you want to measure the lux level in a light booth, you should purchase a lux meter (search the Internet for “lux meter” and you will find many).

The luminous emittance of a lamp in a light box will drop in power over time, as much as 50%. Typically the lamps are standard 4 foot D65 fluorescent tubes that can be replaced. Replacement of the lamps should bring a light booth back into conformance in terms of amount of power as with the lux power requirement of 810 to 1880 lux is quite broad.

Posted in Color And Appearance Theory

Instrument Geometry – Directional 45°/0° or Diffuse d/8° Sphere?

Posted on Feb 09, 2024 by HunterLab

Directional or Diffuse?… just look in the port.

Differentiating Between Directional 45°/0° and Diffuse d/8° Sphere Geometries in Instruments

The geometry of an instrument is the relative position of the light source, sample plane and detector, and is one of the 6 key parameters that define a color measurement. There are two general categories of instrument geometries – directional 45°/0°(or 45°/0°) and diffuse d/8° sphere.

To tell the difference between directional and diffuse instrument geometries, look in the port. If the inside is black, when the lights are on, the instrument has a CIE directional 45°/0°(or 45°/0°) geometry. If the inside is white, then it is a CIE diffuse  d/8° sphere geometry instrument.

While both geometries can be used for color measurement, it is best to measure some samples with a directional 45°/0° geometry instrument and others with diffuse d/8° sphere. More information in our Application Notes at AN 1033.00 Color versus Appearance.

Posted in Color And Appearance Theory

Metamerism Index

Posted on Feb 09, 2024 by HunterLab

Visual examples of metamerism.

Understanding Metamerism in Color Matching

Why do the samples above look the same under one lighting condition but different under another? These samples exhibit metamerism, which means they match under some lighting conditions but not others. This can be a serious problem for manufacturers, especially those who combine various parts of different materials or sources into one product. Customers expect all parts of the products that they purchase to match in daylight as well as under the fluorescent lights of department stores or the tungsten light of their home.

As a result of this phenomenon, a Metamerism Index (MI) has been developed. The MI is a single number index that indicates how well two samples that match under one illuminant will match under another illuminant. The MI is calculated with the ΔL, Δa, and Δb values of a sample and a standard under a reference illuminant and a test illuminant. Usually the D65 illuminant (daylight) is used as the reference illuminant. For the MI to be meaningful and accurate the samples should be a good match under the reference illuminant.

HunterLab instruments and software have the ability to measure L a b values under a wide variety of illuminants and are well suited to measuring MI values. This allows HunterLab customers to evaluate their product under different lighting conditions to ensure that their product will meet their customer’s needs.

Posted in Color And Appearance Theory

Measuring Visual Differences with dE CMC

Posted on Feb 09, 2024 by HunterLab

Visual differences of preforms

Can you see a visual difference between the three samples above? Chances are if you can see a difference between samples then HunterLab instruments can measure and quantify these variances. There are several ways to quantify differences with color measurement. You can evaluate dL* da* and db* values to see how samples vary from a standard within the L* a* b* color scale. There are also single number metrics that can be used to quantify color differences. Although dL* da* and db* values define color differences well a single number Pass/Fail measurement that defines a 3 dimensional tolerance can be helpful.

One of the most robust single number color quality metrics is dE CMC (also called delta E CMC.) dE CMC is an elliptical tolerance that was developed by the Color Measurement Committee of the Society of Dyers and Colorists. Color differences calculated using the CMC method are believed to correlate better with visual assessment than other color differences. The CMC ellipse is unique in that the shape of it changes depending on where the standard is in color space.

A dE CMC value of 1 represents an approximate visual difference for a very flat uniform surface, such as a tile. However, most sample types are not a uniform tile. What tolerances are acceptable varies depending on the application. Customers have to balance minimum perceptible differences with maximum acceptable differences in their products. The size of the dE CMC ellipse can be adjusted to the maximum acceptable limit by adjusting a factor in the CMC calculation.

In the samples above a clear visual difference can be observed. Our instruments were able to measure and quantify this difference. The product in the middle is the standard and the samples to the left and right represent unacceptable colors. The sample on the left measured a dE CMC value of approximately 19 and the sample on the left measured a dE CMC value of approximately 4. One of the major benefits of HunterLab instruments is that they are able to quantify color differences that are visually observed in products.

Posted in Color And Appearance Theory

Where to find pre-soiled and stained fabrics for laundry and cleaning testing

Posted on Feb 09, 2024 by HunterLab

AHAM pre-stained and laundered textile swatches.

Humans wear clothes and clothes require cleaning. There are basically three themes related to the removal of soil and stains.

  1. Testing the effectiveness of laundry detergents and cleaners
  2. Testing the cleaning effectiveness of wash machines.
  3. Staining on textiles using applied or sprayed on liquids.

While information is available on how you can prepare your own soiled or stained textile swatches, it is usually more consistent and cost effective to purchase them. When purchasing, it is important to know what industry test method (AHAM, EMPA, ASTM, IEC 60356, AS/NZ) is required. Below are some suppliers of pre-soiled and stained textile swatches for testing. They may also be able to help with before and after colorimetric measurement evaluation:

Parameter Generation & Control
Black Mountain, NC 28711 USA
+828-669-8717
http://humiditycontrol.com

Testfabrics, Inc.
West Pittston, PA 186543 USA
+803-329-2110
www.testfabrics.com

DLI - Drycleaning and Laundry Institute
Laurel, MD 20707 USA
+301-622-1900
www.dlionline.org

wfk Testgewebe GmbH
D-41379 Brüggen-Bracht, Germany
+49 (-2157) -871977
www.testgewebe.de

Posted in Color And Appearance Theory

Do you have a formula to convert Hunter Lab values to CIE L*a*b*?

Posted on Feb 09, 2024 by HunterLab

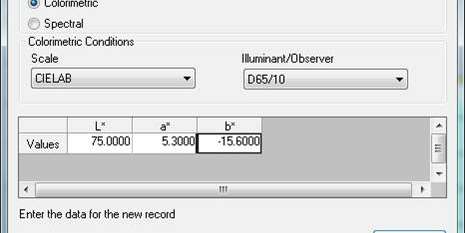
Enter Standard Data window

FAQ: “Do you have a formula to calculate Hunter L, a, b values from CIE L*, a*, b* values?”

The only way to convert between different color scales, illuminants, and observers is to have spectral data for your  samples.

All Hunter L, a, b and CIE L*, a*, b* values are calculated from X, Y, Z values and chromaticity coefficients for the illuminant and observer used. Most color scales are calculated using CIE X, Y, Z tristimulus values. Spectral values from the sample measurement allow for conversion between different color scales, illuminants, and observers because X, Y, Z CIE tristimulus values are calculated from spectral values.

That being said, the HunterLab EasyMatch QC software does have the ability to convert color values assuming you are using the same illuminant and observer. To do this you will first need to enter the color values you want to convert into the EasyMatch QC software. This is done by right clicking in the Job Tree and selecting Enter Standard (or Sample) Data. Select the appropriate color Scale and Illuminant/Observer combination, enter your data, and click OK. Once you enter the Standard (or Sample) ID the values will appear in the Color Data Table.

To convert these values move the mouse to the Color Data Table, right click, and select Configure. Use the drop down menu under Scales to select the color scale you would like to convert to and use the left arrows to move it to the Selected Items list. Click OK to save your changes.

In the Color Data Table you should now see your converted color values.

Posted in Color And Appearance Theory
Prev
1
2
3
4
5
…
Next

Most Related Posts

  • What Is Color Stability and Why Is It Important?
  • Spectrophotometer vs. Colorimeter: What’s the Difference?
  • Food Coloring Regulations and Standards
  • Luminance vs. Illuminance: What’s the Difference?
  • What Is Color, and How Do We See Color?
  • ROY G BIV… A Series
  • The Difference Between Biofluorescence and Bioluminescence
More

Follow Us

  • LinkedIn
  • Twitter
  • YouTube