About
BLOG

Interested in a little light reading?

Our blog is continually updated with helpful educational information, advises, research and insights—all in the name of helping you level-up your color and appearance needs. Grab a drink and enjoy our stories!

Explore Our Stories

"Things to Know About Measuring the Color of Vinyl Siding"

Read More

Explore Our Products

VIEW MORE

"Why Understanding Tristimulus Values and the CIE Color Model Is Important for Color Measurement"

Read More

"What Is a Calibration Curve in a Spectrophotometer?"

Read More

"What Is Color Tolerance and Why Is It Important?"

Read More

"What Is the Difference Between Radiometers, Spectrometers, Spectroradiometers, and Spectrophotometer"

Read More

"Key Differences Between Spectrometers and Spectrophotometers"

Read More

"Best Practices for Measuring the Color of Opaque Plastic Plaques"

Read More

Things to Know About Measuring the Color of Vinyl Siding

Posted on Jul 11, 2025 by HunterLab

Consistent quality and aesthetics are paramount in the competitive world of building materials. For vinyl siding manufacturers, achieving consistent color across production batches is crucial for customer satisfaction and brand reputation. 

Here at HunterLab, we offer state-of-the-art spectrophotometers, advanced quality control software and expert techniques to help you maintain color consistency throughout your vinyl siding production processes.

Understanding the Challenges of Measuring the Color of Vinyl Siding 

Even slight color variations can lead to rejections, returns, and lost revenue. Visually assessing vinyl siding is not enough to achieve accurate, repeatable results and can lead to mismatched siding panels.

Measuring the color of vinyl siding presents unique challenges compared to other materials. Some of these challenges include:

  • Texture variations: Vinyl siding often has a textured surface that can affect light interaction. HunterLab's spectrophotometers have advanced features that can compensate for surface texture variations. They ensure accurate readings regardless of the siding's texture.
  • Large panel sizes: Larger panels magnify any variation in the manufacturing process, from raw material differences to pigment distribution and alterations occurring in storage. A spectrophotometer accurately quantifies color at every stage to help ensure consistent, precise results.

Posted in Plastic

Why Understanding Tristimulus Values and the CIE Color Model Is Important for Color Measurement

Posted on Jul 11, 2025 by HunterLab

Spectrophotometers are a commonly used tool and valuable technology for color measurement. Companies that purchase color measurement equipment can measure the tristimulus values of their sample on the CIE color model.

What Are Tristimulus Values?

The Commission Internationale de l'éclairage (CIE) color model is a color space model that accurately represents every color perceivable to the human eye. The CIE color model plots tristimulus values on a 3D space, which creates a unique color when combined.

Tristimulus values are the CIE reference stimuli in a trichromatic system that mimics human color perception. They are essential for color language because these measurements communicate precise color values without human subjectivity.

This system instrumentally determines the amount of red, green, and blue stimuli under standardized conditions to mimic how the human eye sees. The three values can be expressed as X, Y, and Z coordinates on a graph. The Y value represents the sample's luminance, and together, they represent the sample's color.

With the CIE color model, colors can be accurately expressed, communicated, and reproduced.

Posted in Color Measurement

What Is a Calibration Curve in a Spectrophotometer?

Posted on Jul 11, 2025 by HunterLab

Spectrophotometers are prominent devices in many industries and offer value for many purposes. The concentration of a chemical can be determined using spectrophotometry data. Constructing a calibration curve is one of the ways users employ spectrophotometers. This technique, much like the device, works across many applications. At HunterLab, we specialize in spectrophotometers and support operations that create calibration curves. Calibration curves have applications in several domains, including analytical chemistry and pharmacology.

What Is a Calibration Curve?

A calibration curve, also known as a standard curve, is a way to identify the concentration of an unknown substance. It calculates the concentration of the unknown material and quantitation by comparing the sample to a set of known concentration reference samples. The data fits into a model that predicts unknown concentrations. The concentration of the material causes a change in the analytical signal or instrumental response, as demonstrated by a calibration curve.

Calibration curves are beneficial for compounds that directly absorb light. Typically, a dye consists of molecules that absorb or reemit light, and spectrophotometers can measure that reaction. Begin with a known chemical, measure its absorbance or color attribute, and then graph it. Second, calculate the absorbance of the unknown sample, plot it on a graph, and apply a calibration curve to get the estimated concentration. 

These curves use data points of substances at varied concentrations, and researchers can use these curves to find where an unknown substance plots. An ultraviolet-visible (UV-Vis) spectrophotometer measures the absorbance of a chemical that absorbs light in the ultraviolet or visible parts of the electromagnetic spectrum. This system of identifying unknown substances is valuable to many industries. For example, a calibration curve for the food industry may chart food dye concentrations for gelatin.

Other applications can include:

  • Pharmaceuticals
  • Paints
  • Plastics
  • Chemical production

Simply put, a calibration curve in spectrophotometry is helpful in any situation where a substance is unknown.

How to Make a Calibration Curve

To make a calibration curve, you need the following:

  • A standard solution
  • A solvent for dilution
  • Pipette and tips
  • Five microtubes
  • UV-Vis spectrophotometer

Key steps include:

  • Standard preparation: Create a concentrated standard solution and dilute it to generate five multiple known concentrations.
  • Sample measurement: Using a spectrophotometer, measure each standard solution and your unknown samples at a wavelength of interest or as specified by a colorimetric index, such as the Yellowness Index.
  • Data analysis: Plot the measured result (y-axis) vs. concentration (x-axis)to establish a linear calibration curve. Use statistical software to fit the data to a linear regression equation (y = mx + b) and determine the coefficient of determination (R²) to assess the goodness of fit.

How a Calibration Curve Is Used

Calibration curves are used in many scientific areas to calculate the quantity of unknown chemicals in a sample. Here are some popular applications:

  • Environmental monitoring: Calibration curves are essential for measuring environmental health. They may be used to determine the concentrations of contaminants in soil samples, such as heavy metals or pesticides.
  • Pharmaceutical quality control: It is critical to ensure pharmaceuticals are effective and safe. Calibration curves are used to accurately measure the quantity of active drugs and other components in pharmaceutical samples.
  • Food and beverage analysis: Calibration curves play an important role in guaranteeing the quality of food and drinks, from monitoring caffeine concentration in beverages to ensuring vitamin potency in fortified products.

What Is an Ultraviolet-Visible (UV-Vis) Spectrophotometer?

Posted in Validation And Compliance

What Is Color Tolerance and Why Is It Important?

Posted on Jul 11, 2025 by HunterLab

Color tolerances set acceptable limits for the appearance of a product and are an essential part of quality assurance and quality control processes for color. You can efficiently determine whether a product falls within the limits by establishing tolerances. If it does, the product passes. Failed goods fall outside the tolerances, meaning process adjustments may be necessary to create the desired appearance. 

Many industries, such as food, plastics, and chemicals, rely on accurate appearance. Tolerances enable you to establish a standard and decide how much variation to allow, giving you consistent color outcomes. 

What Is Color Tolerance?

Color tolerances are the parameters within which a product's color can vary yet remain acceptable. Typically, visual assessment is the initial step to define the acceptable color range. Spectrophotometry then objectively and scientifically quantifies and manages those tolerances.

Before establishing tolerance values, you must decide on the observer, choose a color scale, such as Hunter L,a,b, and then select illuminants for comparison, like D 65 and Illuminant A. Depending on what you're measuring, the scale you choose might come from the International Commission on Illumination (CIE), which sets global measurement standards, or from another entity. 

Once you have a comparison standard, you can gather products and measure their color to determine acceptable variations called tolerance values. 

In this process, you start by selecting a relevant standard for your product, then determine how much this standard can vary before it creates visible differences in appearance. This test helps you set boundaries for future production to objectively decide whether products fall close enough to the original standard to conform to quality expectations.


Detecting Color Differences

You can establish tolerances based on two levels of difference:

  • Minimum perceptible difference: A visual comparison shows a just-noticeable difference between the standard and the sample. 
  • Maximum acceptable difference: The level represents the largest acceptable difference between a standard and a sample. 

Focusing on the maximum acceptable difference means a broader range of acceptable values, while relying solely on minimum perceptible difference can lead to high rejection and material waste. As a result, choosing the right approach is typically industry-driven. For example, the food industry frequently uses the maximum acceptable difference, but pharmaceutical manufacturers usually opt for the minimum perceptible difference.

Range of Tolerance Definition

The range of tolerance is the acceptable level of variation related to an established color standard. You will establish this standard using a measurement model like CIE L*a*b*, which results in three values measuring:

  • L*: Lightness, from dark at zero to light at 100.
  • a*: Position on the red–green axis, with the positive number indicating red and the negative indicating green.
  • b*: Position on the yellow–blue axis, with yellow represented as the positive and blue as the negative.

Once you establish a standard, you can decide on each dimension's tolerance. Here are the formulas for determining the difference (∆) between a sample and a reference:

∆L* = L*sample - L*reference

∆a* = a*sample - a*reference

∆b* = b*sample - b*reference

You can also calculate the total color difference across the three values in a single formula, with the results represented by delta E* (∆E*). Here's the formula to determine ∆E*:

∆E* = √((∆L*)2+(∆a*)2+(∆b*)2)

While ∆E* values can be helpful, use this method carefully. When the difference is spread over three dimensions, you may get a value that looks acceptable but has significant variation in one measurement, such as red vs. green. 

This variation will create a noticeable visual difference but may not impact the delta E* value if the other dimensions are close to the standard. If you calculate the difference values separately, you can more closely monitor each one to verify that none stray too far from the standard. 

Posted in Color And Appearance Theory

What Is the Difference Between Radiometers, Spectrometers, Spectroradiometers, and Spectrophotometer

Posted on Jul 11, 2025 by HunterLab

Light and color measurement processes use many types of equipment — radiometers, spectrometers, spectroradiometers, and spectrophotometers. While all four solutions are used to measure electromagnetic energy, they vary widely in their capabilities, applications, and intended purposes. It’s important to know and understand the differences between these solutions to determine which one will adequately serve your needs.

Radiometer vs. Spectrometer vs. Spectroradiometer vs. Spectrophotometer

These devices have similar names and are used to measure spectral data points and wavelengths within the electromagnetic spectrum. Despite this similarity, they have varying scopes regarding the types and qualities of measurements they produce.

Radiometers can only detect and measure electromagnetic radiation within a particular wavelength range. Spectrometers measure a broader scale of electromagnetic energy and have more capabilities, including breaking down signals based on amplitude. Spectrometers are a larger category under which other devices like spectroradiometers and spectrophotometers fall. 

In comparing spectroradiometers vs. spectrometers, the main difference is that spectroradiometers combine the capabilities of radiometers and spectrometers. These devices also collect details about power, radiance, and other metrics.

Spectrophotometers measure the amplitude of light reflected or transmitted by a sample, which can then be used to calculate the exact color. Unlike the other tools, spectrophotometers focus on how transmitted and reflected light generates color rather than on the qualities of the light itself.

What Is a Radiometer?

A radiometer measures the electromagnetic energy present in a specific wavelength range. This solution is typically used to detect and quantify energy outside the visible light spectrum and measure infrared and ultraviolet light. The radiometer begins by measuring the incoming current or voltage in watts, then corrects the signal to create a calibrated, quantitative light level measurement. With this information, the meter provides one reading over the specific wavelength range it is designed to measure.

Pros and Cons of Radiometers
Radiometers are inexpensive and portable, making them a cost-effective and practical choice. This solution can identify troublesome UV energy and detect and measure heat energy on surfaces. It also has one sensor that allows it to quickly measure all intended wavelengths.

However, radiometers cannot identify emitted wavelengths or their individual amplitude. Sometimes, variations exist in the filter used to match the light source, which creates difficulty when comparing results from radiometers of different manufacturers. Also, radiometers only measure a particular range of wavelengths, unlike other tools. 

Applications

Radiometers' ability to detect the presence of UV energy makes them valuable tools for any application where it is undesirable, such as museum lighting. In this atmosphere, UV energy could degrade artifacts or artwork.

The device also measures infrared light, enabling surface temperature measurements in settings such as along an assembly line or on a road's surface. Other applications include monitoring weather, like precipitation and wind speeds

Posted in Color In Pharmaceuticals

Key Differences Between Spectrometers and Spectrophotometers

Posted on Jul 11, 2025 by HunterLab

“Spectrometer” is a general term for any instrument that measures how electromagnetic radiation interacts with matter. A spectrophotometer is a specific type of spectrometer designed to measure how much light is reflected or transmitted by a sample across a range of wavelengths representing typical human vision. Both are critical quality assurance equipment in many industries, yet each has its distinct purposes and ideal applications. Exploring their traits and differences will help you determine which option best meets your unique business demands.

What Are Spectrometers?

This equipment quantifies the electromagnetic radiation within specific wavelengths of a sample.

Modern spectrometer types include the following:

  • Nuclear magnetic resonance (NMR) spectrometers that help biochemists evaluate the properties of organic molecules
  • Optical spectrometers that measure the intensity of light at different wavelengths to analyze the optical properties of a sample
  • Mass spectrometers that analyze a sample's molecular mass to help identify its molecular composition

Benefits of Spectrometers

Advantages of spectrometers include:

  • Sensitivity: These advanced solutions can detect even trace amounts of many elements and compounds and minute variations within samples.
  • Versatility: Spectrometers can quantify spectra from liquids, solids, and gases.
  • Wide spectrum: Optical spectrometers can measure and quantify wavelengths beyond the visible spectrum, such as ultraviolet rays and infrared light.

Ideal Applications for Spectrometers

These solutions are essential in many industries and applications, such as:

  • Life sciences
  • Criminal forensics
  • Material characterization
  • Pollution monitoring
  • Space exploration
  • Water quality
  • Agricultural analysis

Posted in Instruments And Software

Best Practices for Measuring the Color of Opaque Plastic Plaques

Posted on Jul 11, 2025 by HunterLab

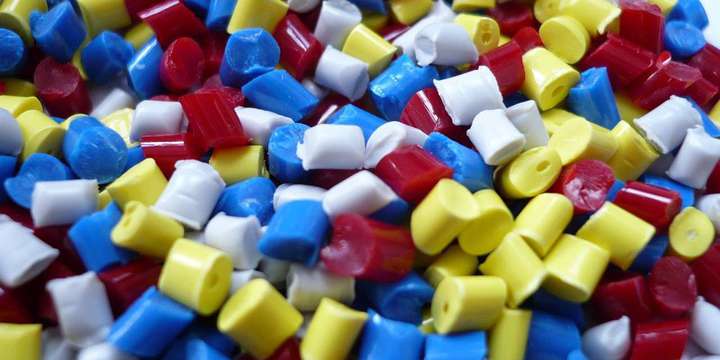
Plastic plaques play a crucial role in evaluating the color and appearance of plastic pellets, serving as a reliable medium to transform raw materials into a tangible, uniform surface for precise analysis. These plaques are pressed under controlled conditions, allowing manufacturers to assess how the pellets' color manifests when formed into a flat, consistent shape. To further enhance their utility, plaques can be produced with varying surface characteristics, such as different gloss levels and textures, to evaluate the visual impact of these properties on color perception. This process ensures that the final product meets both aesthetic and functional requirements, providing a critical quality check in industries where appearance consistency is paramount, such as automotive, consumer goods, and packaging. 

Opacity and Color Measurement

Opacity refers to a material's ability to prevent light from passing through. When measuring color in opaque materials, we focus on reflectance. Reflectance is how light interacts with the plastic's surface and reflects to our eyes. Visual color comparisons are unreliable due to limitations in human color perception and the inability to account for texture variations. Spectrophotometers can standardize conditions to ensure the measurement is consistent and repeatable. 

Posted in Color In Plastics
Prev
1
2
3
…
Next

Most Related Posts

  • Things to Know About Measuring the Color of Vinyl Siding
  • Why Understanding Tristimulus Values and the CIE Color Model Is Important for Color Measurement
  • What Is a Calibration Curve in a Spectrophotometer?
  • What Is Color Tolerance and Why Is It Important?
  • What Is the Difference Between Radiometers, Spectrometers, Spectroradiometers, and Spectrophotometers?
  • Key Differences Between Spectrometers and Spectrophotometers
  • Best Practices for Measuring the Color of Opaque Plastic Plaques
More

Follow us on social

  • LinkedIn
  • YouTube
  • facebook
  • X
  • instagram