About
BLOG

Interested in a little light reading?

Our blog is continually updated with helpful educational information, advises, research and insights—all in the name of helping you level-up your color and appearance needs. Grab a drink and enjoy our stories!

Explore Our Stories

"The Perfect Cup: Creating the Right Coffee Blend with Color Measurement"

Read More

Explore Our Products

VIEW MORE

"Color-Coding Technology: 50 Shades of Grey Pills?"

Read More

"Can Spectral Analysis Be Used to Monitor Fluoride in Drinking Water?"

Read More

"What Is a Calibration Curve in a Spectrophotometer?"

Read More

"Visual Assessment: When the Human Eye Is Just Not Enough for Accurate Color Measurement"

Read More

"Spectrophotometric Analysis: The Nuances of Coffee Bean Color During the Roasting Process"

Read More

"Using Carrageenan Color Analysis to Improve the Visual Appeal of Food Products"

Read More

The Perfect Cup: Creating the Right Coffee Blend with Color Measurement

Posted on Feb 13, 2025 by HunterLab

Coffee is quickly taking over around the world as the drink of the new millennium. I am not talking about the boring bargain roast with which our grandparents stocked their pantries in the 1950’s. Today’s coffee options are nearly limitless, and creating the right coffee blend has developed into both a science and an art. Just like other food products in the agricultural industry, careful grading systems and protocols are being used to determine quality in raw coffee beans and create the right coffee blend by meeting precise roasting standards with color measurement instrumentation.

Coffee is quickly taking over the world as a preferred beverage option. Creating the perfect roasts and blends depends on the highest quality of color measurement and classification systems. Image Source: Flickr user SPT Photographe

Posted in Color In Food Industry

Color-Coding Technology: 50 Shades of Grey Pills?

Posted on Feb 12, 2025 by HunterLab

Color-coding technology may be one of the most valuable tools to consider when it comes to prescription medications. The rainbow of pills lining the shelves of our local drug stores do not simply appeal to an eccentric and liberal palate; they are a product of color-coding technology that is used to provide security to both the patient and the healthcare industry. Pharmaceutical companies know the importance of quality control and color application in the production of prescription medications and the equipment needed to maintain safety. Spectrophotometers provide the essential piece of technology needed to monitor and develop pharmaceutical products that are easy to identify, which can play a crucial role towards eliminating the extensive margin of human error.

Although advancements in pharmaceuticals and medications have led to a significant increase in quality of life, the variety and sheer number of prescription medications on the market today have greatly increased the numbers of errors. Today, more medical mistakes are linked to prescription drugs than any other cause, and have created a crisis in the healthcare industry that has led to financial and even fatal consequences.

Taking pill identification beyond “Little, Yellow”

Research by the Institute of Medicine has shown that approximately four out of five adults take some form of medication every week, and nearly one-third of those individuals are taking a least five or more various pills per day. With the number of prescription drugs at an all-time high, the ability to differentiate between liquid, powder, capsule, or pill is getting more and more difficult and the human eye alone cannot accurately differentiate between them. Added to the fact that prescriptions today are labeled with names that sound and look very similar, any miscalculations can have extremely harmful outcomes.That is why the Food and Drug Administration (FDA), Drug Evaluation and Research (CDER), and the Division of Medication Error Prevention and Analysis (DMEPA) are all working together to create and enforce stricter guidelines for specific labeling and advancement in spectrophotometers, color-technology, and the color-coding of prescription medications.

Posted in Color In Pharmaceuticals

Can Spectral Analysis Be Used to Monitor Fluoride in Drinking Water?

Posted on Feb 12, 2025 by HunterLab

Fluoride is a common additive in drinking water around the world, but careful monitoring its concentration for safety and effectiveness is important. There are several methods commonly used for quantification of fluorine in drinking water: Fluoride Ion Selective Electrode (F-ISE) and spectral analysis. These methods are both effective, but we will explore how spectral analysis may provide a more simple method for fluorine quantification, as well as its uses for monitoring the safety and quality of various water sources around the world.

Fluoride is a common additive in our drinking water supply. Spectral analysis uses colorimetric technology to identify fluoride compounds in water samples and quantifies them both rapidly and effectively. Image Source: Flickr user Steve A Johnson

Posted in Color In Chemical Industry

What Is a Calibration Curve in a Spectrophotometer?

Posted on Feb 12, 2025 by HunterLab

Spectrophotometers are prominent devices in many industries and offer value for many purposes. The biological concentration of a chemical can be determined using spectrophotometry data. Constructing a calibration curve is one of the ways users employ spectrophotometers. This technique, much like the device, works across many applications. At HunterLab, we specialize in spectrophotometers and support operations that create calibration curves. Calibration curves have applications in several domains, including analytical chemistry and biology.

What Is a Calibration Curve?

A calibration curve, also known as a standard curve, is a way to identify the concentration of an unknown substance. It calculates the concentration of the unknown material and the limits of detection and quantitation by comparing the sample to a set of known concentration reference samples. The data fits into a model that predicts unknown concentrations. The concentration of the material causes a change in the analytical signal or instrumental response, as demonstrated by a calibration curve.

Calibration curves are beneficial for compounds that indirectly cause absorbance. Typically, a dye reacts with the molecule of interest, and the dye is measured to determine what is going on with the molecule. Begin with a known chemical, measure its absorbance, and then graph it. Second, calculate the absorbance of the unknown sample, plot it on a graph, and apply a calibration curve to get the estimated concentration. 

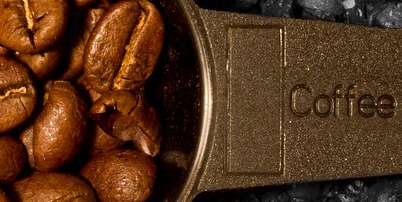
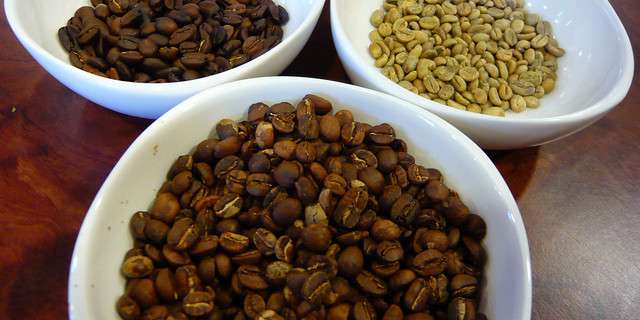
These curves use data points of substances at varied concentrations, and researchers can use these curves to find where an unknown substance plots. An ultraviolet-visible (UV-VIS) spectrophotometer measures the absorbance of a chemical that absorbs light in the ultraviolet or visible parts of the electromagnetic spectrum. This system of identifying unknown substances is valuable to many industries. For example, you may find a calibration curve in coffee production for determining a roast. With a plot of caffeine content, roasters can discover where a bean falls. A calibration curve for the food industry may chart food dye concentrations for gelatin.

Other applications can include:

  • Pharmaceuticals
  • Paints
  • Plastics
  • Chemical production

Simply put, a calibration curve in spectrophotometry is helpful in any situation where a substance is unknown.

How to Make a Calibration Curve

To make a calibration curve, you need the following:

  • A standard solution
  • A solvent for dilution
  • Pipette and tips
  • Five microtubes
  • UV-Vis spectrophotometer
  • Computer

Key steps include:

  • Standard preparation: Create a concentrated standard solution and dilute it to generate five multiple known concentrations.
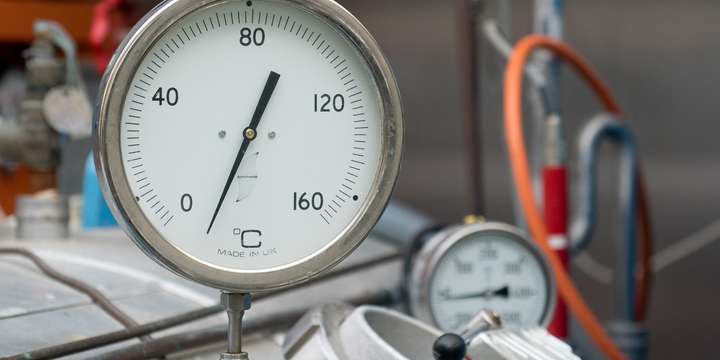
  • Sample measurement: Using a spectrophotometer, measure the absorbance of each standard solution and your unknown samples.
  • Data analysis: Plot the absorbance (y-axis) vs. concentration (x-axis)to establish a linear calibration curve. Use statistical software to fit the data to a linear regression equation (y = mx + b) and determine the coefficient of determination (R²) to assess the goodness of fit.

How a Calibration Curve Is Used

Calibration curves are used in many scientific areas to calculate the quantity of unknown chemicals in a sample. Here are some popular applications:

  • Environmental monitoring: Calibration curves are essential for measuring environmental health. They may be used to determine the concentrations of contaminants in soil samples, such as heavy metals or pesticides.
  • Neuroscience research: Measuring neurotransmitter levels is frequently used to understand the complex workings of the brain. Calibration curves allow researchers to calculate the concentration of these signaling chemicals in brain fluids.
  • Pharmaceutical quality control: It is critical to ensure pharmaceuticals are effective and safe. Calibration curves are used to accurately measure the quantity of active drugs and other components in pharmaceutical samples.
  • Food and beverage analysis: Calibration curves play an important role in guaranteeing the quality of food and drinks, from monitoring caffeine concentration in beverages to ensuring vitamin potency in fortified products.

What Is an Ultraviolet-Visible (UV-Vis) Spectrophotometer?

Posted in Validation And Compliance

Visual Assessment: When the Human Eye Is Just Not Enough for Accurate Color Measurement

Posted on Feb 12, 2025 by HunterLab

The human eye is made up of over two million parts making it second only to the brain in complexity. Image Source: Flickr user Ali T

As I drove down the road today, the colors painting the landscape reminded me why I love this time of year. In my part of the country the trees are beginning to turn bright hues of golden-yellow and reddish-orange. Every day I am amazed by the stunning visual assessment of color that our human eyes are capable of. Fall is also the time of year that has me reflecting on the colors that line the isles of my local store as I contemplate my next autumn-inspired wardrobe or décor purchase, or comforting crockpot meal. Once again the visual assessment of color invigorates my senses… and my purchasing choices, too.

The amazing human eye

The eye is one of the most important and complex parts of the human body. Consisting of over two million working parts and is second only to the brain in complexity. It is no wonder why vision is such an essential part of who we are and the way we perceive the world. Our visual assessment directs the way we feel, our choices in clothing, the foods we eat, and the products we buy.

We use our sense of sight on a daily basis to make decisions and choices, and despite variations in visual assessment from one person to the next, it is still more consistent than our sense of taste or smell. With the ability to decode up to 50 shades of gray and over 10 million different color combinations, it is no wonder that both scientists and manufacturers want to know more about how color influences the population.

Posted in Color Measurement

Spectrophotometric Analysis: The Nuances of Coffee Bean Color During the Roasting Process

Posted on Feb 12, 2025 by HunterLab

The process of roasting coffee begins with heat and a swelling of pastel green beans. First shedding their silver skins, cycles of bursts and darkenings soon follow, transforming the color of the beans from green to tan to the deepest browns. Eventually, the beans shrink, ending their life cycles in a quick, smooth blackening and hardening of their skins.

Coffee beans undergo a series of changes from the green beans, observed at the top right, to the darker colors that occur upon roasting.
Image Source: Flickr CC user Jessica Spengler

The physical changes that occur during the roasting process might seem straightforward; however, hundreds of chemical reactions are occurring in tandem. Proteins, polysaccharides, lipids and organic acids undergo decarboxylation and dehydration events as Maillard browning and caramelization occur among redox and polymerization reactions. Together, these events result in the disappearance of some reactants and the appearance of many more, which themselves add flavor and aroma to the beans. Importantly, roastmasters have used and still use color to determine when a roast has undergone the multitude of chemical changes described above and is considered “finished.”

Posted in Color In Food Industry

Using Carrageenan Color Analysis to Improve the Visual Appeal of Food Products

Posted on Feb 12, 2025 by HunterLab

The holiday season has come and gone, and I find myself, as usual, having consumed more than my fair share of sweets. With the arrival of the New Year, I’m trying to cut back on sugary foods, but ice cream is one treat that’s not getting scratched from my list (it is in the dairy/protein family anyway, right?).  Honestly, I find it hard to avoid most creamy-textured foods—which makes sense, since they’re often specifically engineered to be appealing.

The rich creaminess of ice cream makes it appealing both visually and texturally. Image Source: Flickr user gordonramsaysubmissions (CC BY 2.0)

Carrageenan is not an ingredient that pops up on most consumers’ radars when they check labels, yet it’s responsible for improving the texture and appearance of many of the food products they consume daily. Extracted from an edible red seaweed and converted into powdered form, this natural derivative is added to a variety of foods, from dairy products and beverages to processed meats1. And though carrageenan powder is white in appearance, it often remains undetectable thanks to carrageenan color analysis and instrumental quality control.

Posted in Color In Food Industry
Prev
5
6
7
8
9
…
Next

Most Related Posts

  • HunterLab’s Global Commitment: Stability, Service, and Support Amid Supply Chain Pressures
  • What Is Color Stability and Why Is It Important?
  • Best Practices to Measure the Color of Candy
  • Best Practices for Measuring the Color of Plastics
  • Reducing Process Variation of Cocoa Powder With Color Spectrophotometers
  • What to Know About Baking Powder and Its Color
  • How Color Measurement via Spectrophotometers Is Bringing Milk Powder Production to New Heights
More

Follow Us

  • LinkedIn
  • Twitter
  • YouTube