New polymer products continue to flood the market, and there seems to be no end to the continued growth in plastic manufacturing. In 2024, the global molded plastics market reached a value of $541.2 million. Experts predict a compound annual growth rate of 7.5% over the next decade, which means the market's value will surge to over $1 billion by 2034. In this booming market, competition with large manufacturers may seem daunting, yet small business continues to thrive.
To stay competitive among these giants, choosing the right spectrophotometer for plastics is often the difference in product efficiency and quality. Understanding the value of color measurement in plastic production is the first step toward optimizing growth and increasing sales overall.
Utilizing Spectrophotometric Instrumentation in Plastic Production
Modern spectrophotometers measure more than the tristimulus values captured by basic equipment. They offer spectral measurement capabilities and can quantify appearance by considering the influences of gloss and texture on perception. This technology makes them an ideal choice for many plastics, which often feature various shapes, textures, and opacities.
Sample types determine the right measurement techniques for accurate color data, so understanding these characteristics that drive your approach is the first step to utilizing your color measurement solutions. For example, accurate color quantification for transparent plastic preforms requires measuring via transmission, while opaque plastics require reflectance measurements.
The device’s geometry is also critical to ensure accurate appearance data capture. A directional 0°/45° geometry illuminates the sample at a 0° angle, with the viewing angle set at 45°. Scientific studies show that these geometric principles provide the truest representation of visual color perception.
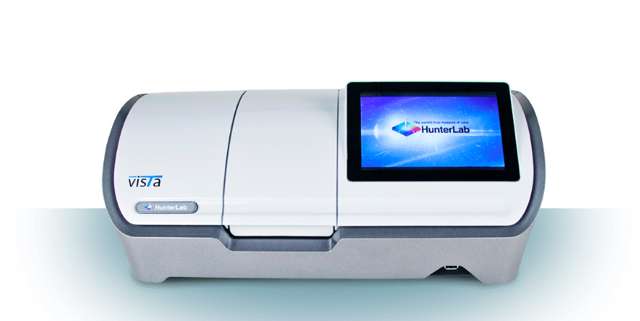
Today’s spectrophotometers/colorimeters are available in portable, benchtop, and in-line models, designed to monitor color variations and changes in real time, from start to finish. Even slight alterations in color can be detected easily and allow for simple changes to be made at any stage of production, saving wasted materials, time, and money. These simple tools are beneficial for efficiently and effectively creating quality products and increasing sales.
Spectrophotometric Applications in Plastic Manufacturing
The variety in plastic shapes, sizes, and colors can present color measurement challenges. Nonuniformity, gloss, shape, and size can all affect color quantification, so choosing the right solution is the first step in developing consistency and quality in polymer products.
Not only are spectrophotometers/colorimeters effective for enhancing the quality and production of molded plastics, but their versatility also extends to many other areas of plastic manufacturing. For example, even nonuniform plastic pellet samples and recycled polyethylene terephthalate (rPET) can be accurately measured with this equipment. Doing so helps to ensure uniform and consistent pellet color, which is used in extrusion and injection molding and directly affects final color quality.
Other spectrophotometric applications in plastics processing include quantifying color data in:
From the beginning stages of plastic production to the final stages of color analysis in sample plaques, spectrophotometry ensures consistency throughout every step of manufacturing. The simplicity and accuracy of today’s advanced instrumentation take the guesswork out of the process, increasing both production and quality overall.